
1. The Global Challenge: The “Reporting Fatigue” in Account Management
In the contemporary E-commerce landscape, Account Managers (AMs) serve as the vital bridge between data and brand strategy. However, a significant “productivity leak” exists: AMs often spend 60-70% of their reporting cycle on manual data extraction and formatting. This “Reporting Fatigue” creates a bottleneck where managers act as data processors rather than strategic advisors, leaving little room for deep-dive optimization.
2. Case Study: Decoding Unilever Homecare (HC) Complexity
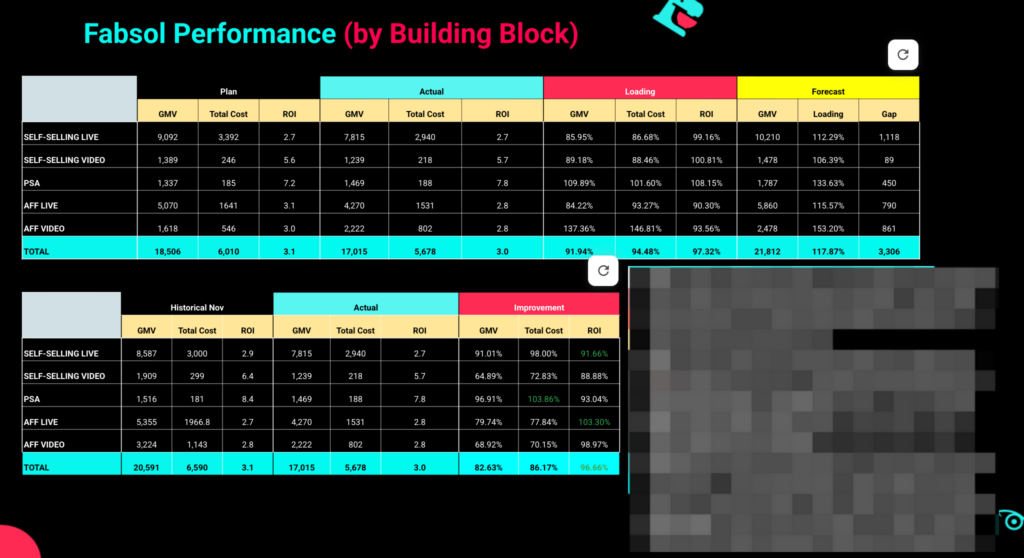
Managing the Unilever Homecare portfolio—comprising Fabsol (Omo), Fabsen (Comfort), and H&H (Vim/Sunlight)—presents a high-density data environment. A typical monthly raw report contains hundreds of variables across multiple Building Blocks such as Self-Sell Live (SSL), Video (SSV), and Affiliate channels.
- The Problem: Looking at raw tables showing Direct GMV of 23,752 or Total Spend of 7,792, it is difficult to instantly pinpoint why H&H surged by 259% since October, while other segments fluctuated.
- The Solution: By applying a strategic AI Prompt Engine, we transform static numbers into a narrative. Instead of manually calculating loading percentages, the AI identifies root causes: for instance, recognizing that Fabsol’s SSL forecast loading of 113% was driven by Omo Liquid Combo 2 improving its CTOR from 4.9% to 6.0%.
3. Methodology: The AI-Enhanced “Deep-Dive” Workflow
The application of AI allows the AM team to move through a three-tier professional hierarchy in a fraction of the time, focusing solely on data detectable from raw reports:
A. AI-Driven Detection (The AI “Eyes”)
AI scans the “Improvement,” “Actual,” and “Loading” columns to identify the “Big Picture” signals that are often missed by manual review.
- Positive Signals: AI identifies H&H as the “Growth Engine” with an explosive 259% surge since October.
- Efficiency Signals: AI detects that while Fabsol’s SSV is on-track with 106.39% Forecast Loading, there is a noticeable ROAS dip from 6.4 to 5.7.
- Volume Anchors: AI confirms Fabsol as the primary volume driver, maintaining a dominant 17B GMV actual contribution.
B. AM Strategic Synthesis (The AM “Brain”)
Once the AI has flagged the anomalies, the AM performs a “Strategic Synthesis.” The AM takes the AI’s data points—such as the 113.29% Forecast Loading for SSL or the 153.20% potential for AFF Video—and contextualizes them into a business narrative.
- Interpreting Gaps: If AI flags a Loading Gap (e.g., SSL at 85.95% Plan Loading), the AM determines if this is a budget pacing issue or a conversion problem.
- Scaling Decisions: The AM uses the AI’s detection of the 137.36% GMV Loading in AFF Video to justify reallocation of resources toward high-growth channels.
C. Final Strategic Synthesis (Finalize Report)
The AI converts these confirmed findings into professional, slide-ready wording. Instead of a simple “GMV is up,” the AI drafts: “Leverage the 153.20% forecast potential in Affiliate Video by optimizing current high-demand SKU rotations”.
4. Conclusion and Universal Application
Integrating AI into the reporting workflow is not about replacement; it is a force multiplier that reduces deep-dive analysis time by 2-3 hours per session. By offloading data synthesis to AI, we elevate our role from “reporting” to “strategic management.”
To empower all AMs across the organization, I propose the following Master Prompt for your monthly reporting cycles:
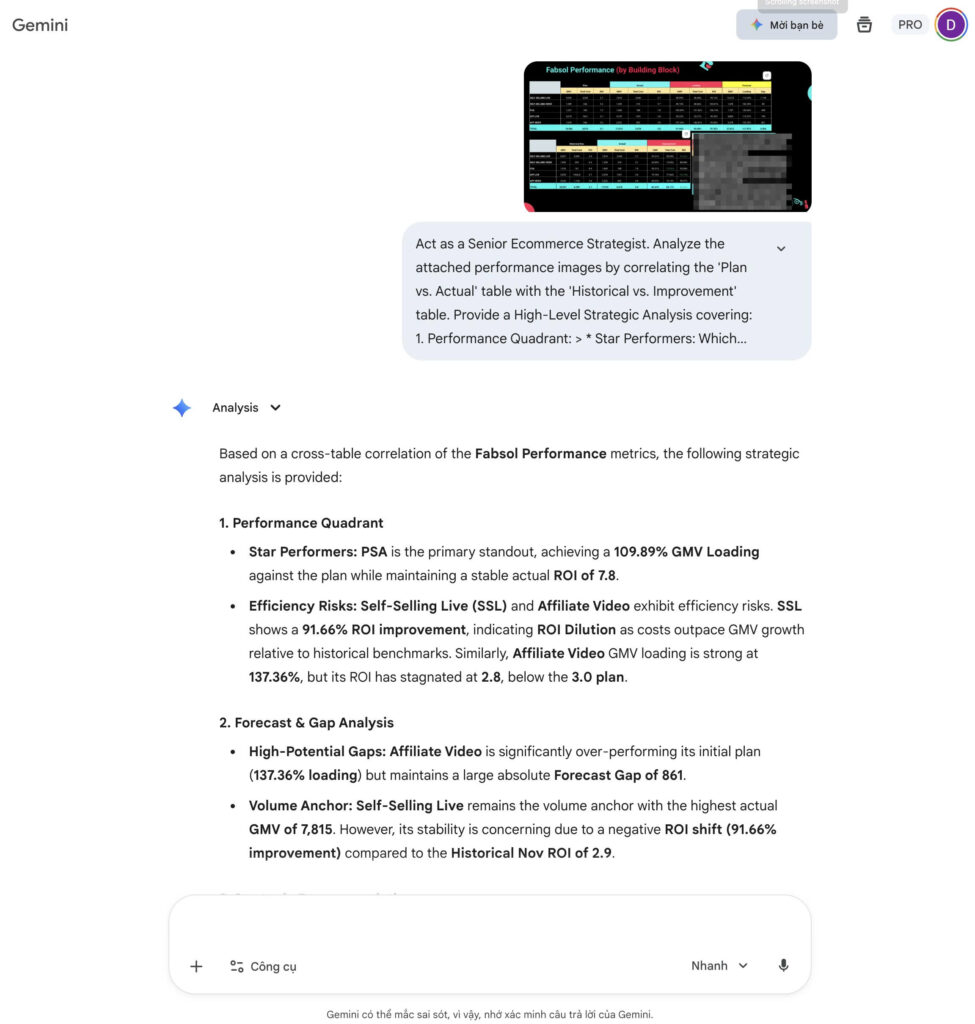
[THE MASTER PROMPT] *”Act as a Senior Ecommerce Strategist. Analyze the attached performance images by correlating the ‘Plan vs. Actual’ table with the ‘Historical vs. Improvement’ table. Provide a High-Level Strategic Analysis covering:
1. Performance Quadrant: > * Star Performers: Which segments have >100% GMV Loading AND positive ROI improvement?
- Efficiency Risks: Which segments show ‘Total Cost’ increasing faster than ‘GMV’ improvement?
2. Forecast & Gap Analysis: > * Analyze the ‘Forecast Loading’ vs. ‘Actual Loading’. Which segments are over-performing their initial plan but still have a large ‘Gap’ (numerical value) to capture?
- Identify the ‘Volume Anchor’ (Highest GMV contributor) and evaluate its stability based on the ROI shift in the Improvement table.
3. Strategic Recommendations (Data-Led): > * Based ONLY on the numbers, where should budget be reallocated? (e.g., from low-loading/declining ROI segments to high-loading/improving ROI segments).
- What specific ‘Forecast Loading’ target should be the priority for next month?
4. Executive Summary: > * Summarize the ‘Actual Total’ vs ‘Plan Total’ health.
- Use professional terminology: Revenue Pacing, Marginal Efficiency, Forecast Variance, and ROI Dilution.
Format: Academic tone, structured bullet points, Data-Driven
Language: English
Length: 100-250 words
In conclusion, the “AI + AM Synergy” is our competitive advantage. It allows us to manage massive portfolios like Unilever Homecare with surgical precision. As we move into 2026, the challenge for every AM is no longer to be the person who makes the report, but to be the strategist who acts on it.
“AI won’t replace the Account Manager, but the Account Manager who uses AI will replace the one who doesn’t.”